
Building a Winning Assortment: Category Mix, Margin Math, and Inventory Turnover for the Independent Pet Store
The single biggest lever on an independent pet store’s profitability is not your rent, your staff, or even your foot traffic — it is your assortment. What you stock, in what proportion, at what margin, and how fast it rotates determines whether you run a thriving community hub or a cash-starved warehouse. This guide gives you a working category mix, the retail-math toolkit every buyer should carry (GMROI, turnover, ABC analysis, weeks-of-cover), and a concrete method — scenario-based kits — to launch a new category with minimal risk and near-instant shelf setup.
The Assortment Problem Every Independent Faces
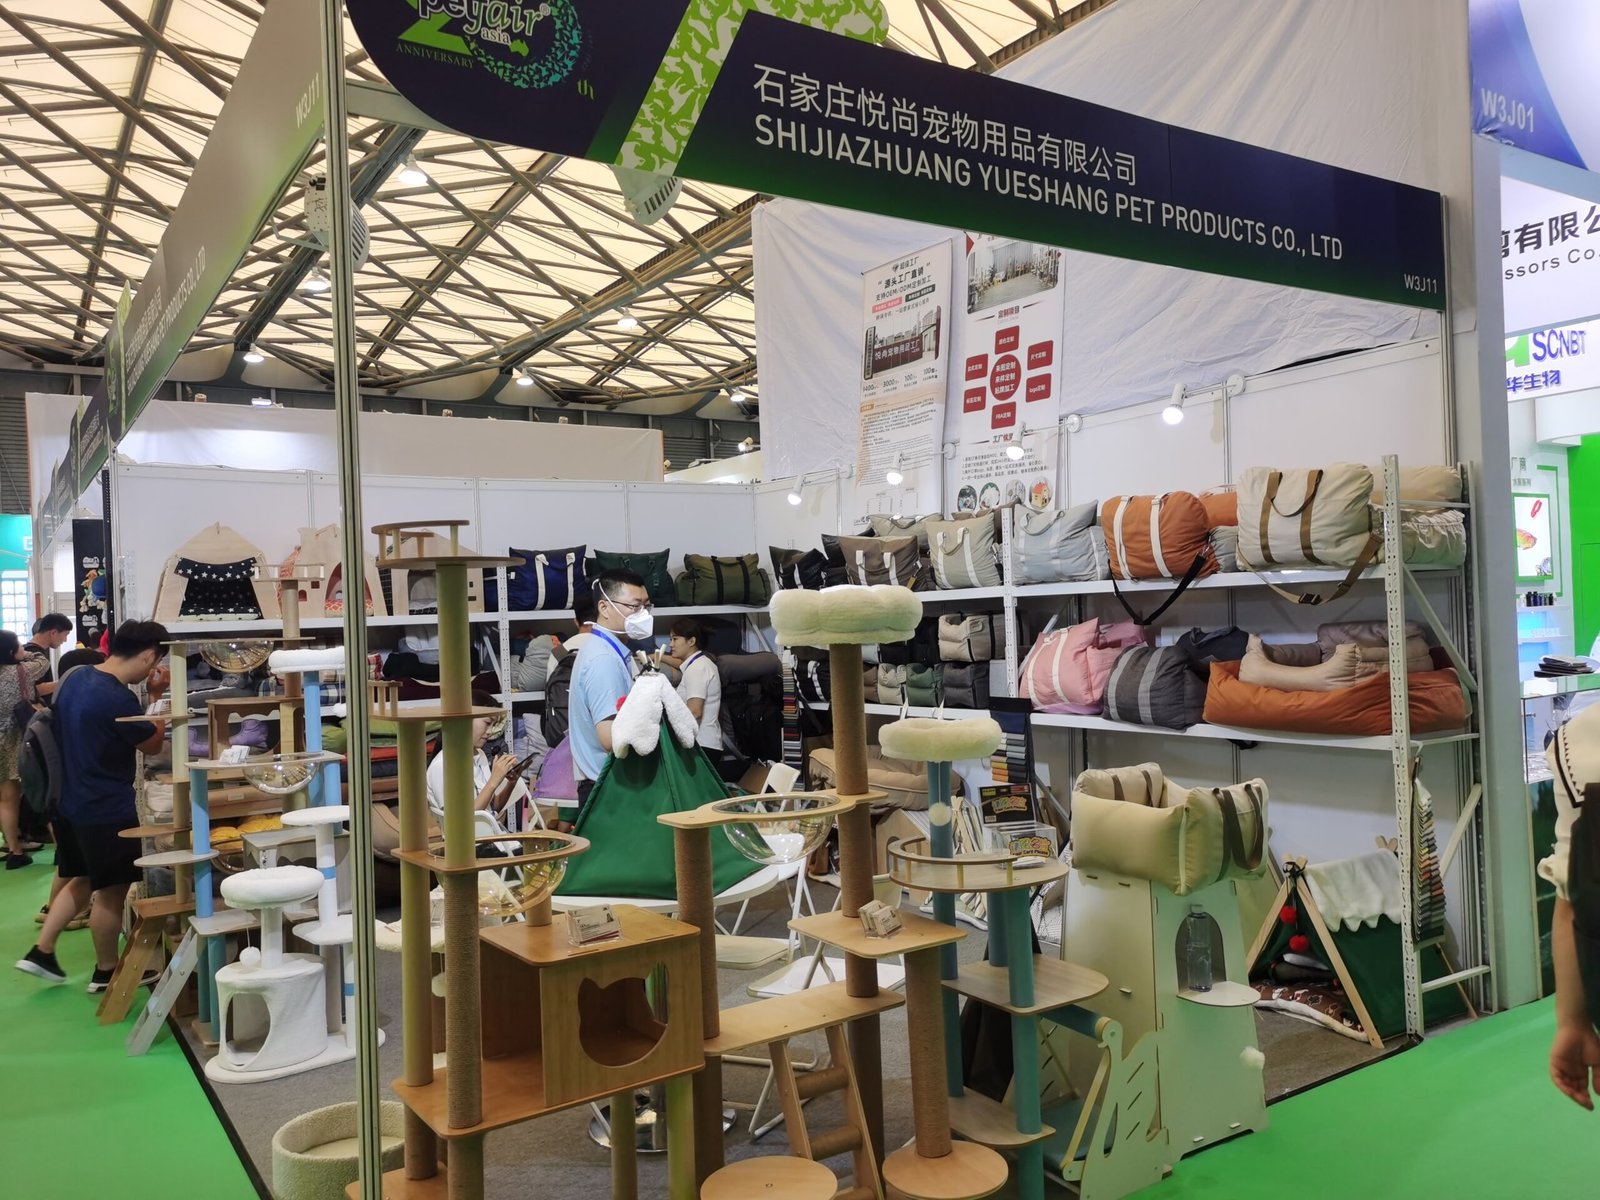
Large chains win on scale; you cannot out-buy them. What you can do is out-curate. A 1,200 sq ft independent store does not need 14 brands of the same kibble. It needs a tight, high-velocity assortment where every facing earns its rent. The discipline is saying no — to slow movers, to margin-destroying bulk items, and to “looks cool but nobody buys it” novelties.
The data pattern is consistent across independent pet retail: a small number of SKUs drive the majority of profit, while a long tail of slow items ties up cash and shelf space. Your job is to find that profitable core, protect it, and experiment with the edges cheaply. The frameworks below make that operational.
Recommended Category Mix for a Small Independent
The following mix is a starting blueprint for a typical 800–1,500 sq ft store with a neighborhood clientele. Adjust by local demand, but treat the proportions as your default hypothesis.
| Category | Target % of shelf | Target gross margin | Rationale |
|---|---|---|---|
| Food (dry & wet) | 40% | 25–35% | Traffic driver and repeat-purchase anchor; lower margin but highest frequency. Customers come back every 2–4 weeks. |
| Treats & chews | 15% | 40–55% | Impulse + high margin; pairs with food trips. Strong attach rate at checkout. |
| Toys | 15% | 45–60% | High margin, emotional purchase, giftable. Rotates with seasons and pet life stages. |
| Accessories (leashes, bowls, beds, apparel) | 15% | 40–55% | Mid-margin, broad appeal, drives basket size beyond consumables. |
| Wellness & care (supplements, dental, grooming) | 10% | 45–65% | Highest margin tier; builds the “expert” positioning and repeat wellness routines. |
| Seasonal & promotional | 5% | 40–60% | Flex space for holidays, local events, and test assortments. Keeps the store feeling fresh. |
Notice the logic: 55% of your space is consumables (food + treats) that pull repeat traffic, while 40% is higher-margin non-consumables (toys, accessories, wellness) that lift basket value. Seasonal is your “lab” — the 5% you use to test, then promote winners into the core.
The exact proportions shift by store. A store next to a dog park might overweight toys and accessories; a store in a cat-dense apartment neighborhood leans into the Cat Play Kit and cat wellness. But the 40/15/15/15/10/5 skeleton is the safe launch position.
The Retail-Math Toolkit
You cannot manage assortment on gut feel at scale. Four metrics turn buying from art into engineering.
1. GMROI — Gross Margin Return on Investment
GMROI answers: “For every dollar I put into inventory, how many gross-margin dollars did I get back?”
GMROI = (Annual Gross Margin $) ÷ (Average Inventory Cost $)
A GMROI of 3.0 means each $1 of average inventory returned $3 in gross margin. General rule of thumb for healthy pet retail: target GMROI ≥ 3.0. Below 2.0, the category is absorbing capital it is not returning. Compute this per category, not store-wide — food may run 2.5 while wellness runs 4.5, and that gap is your reallocation signal.
2. Inventory Turnover
Turnover measures how many times you sell through your average stock in a year.
Turnover = Annual COGS ÷ Average Inventory at Cost
Benchmark targets by category (annual turns):
- Food: 12–20 turns (fast, perishable, high frequency)
- Treats & chews: 8–12 turns
- Toys: 4–8 turns (seasonal spikes)
- Accessories: 3–6 turns
- Wellness & care: 4–7 turns
- Seasonal: 3–5 turns (must clear before the holiday window closes)
If your toys turn at 2x while the benchmark is 5x, you are over-assorted or over-stocked in toys. Fix the mix before you fix the marketing.
3. ABC Analysis
Rank all SKUs by annual contribution to gross margin. The classic split:
| Class | Share of SKUs | Share of margin | Action |
|---|---|---|---|
| A | ~20% | ~70–80% | Never stock out. Auto-replenish. Protect shelf space. |
| B | ~30% | ~15–20% | Monitor. Review quarterly. Tighten counts. |
| C | ~50% | ~5–10% | Challenge or cut. Use as filler only if it drives traffic. |
The insight: roughly half your SKUs contribute almost nothing to profit. That is your liberation — you have permission to delete them and free cash for A-items and for testing new ideas.
4. Weeks-of-Cover (WOC)
WOC tells you how long current stock lasts at the current sell rate.
WOC = (On-Hand Units × Weeks in Period) ÷ (Units Sold in Period)
Healthy ranges:
- Food: 3–5 weeks of cover (frequent replenishment, low buffer)
- Treats: 4–6 weeks
- Toys/Accessories: 6–10 weeks
- Wellness: 5–8 weeks
- Seasonal: must hit ~0 by season end
WOC above range = cash trapped in slow stock. WOC below range = stockouts and lost sales. Set a WOC alert per category so replenishment triggers automatically.
A Worked Example: One Category, Two Scenarios
Numbers make the framework concrete. Imagine a wellness category in a 1,200 sq ft store.
Scenario A — current state. Annual wellness COGS = $48,000. Average inventory at cost = $16,000. Gross margin rate = 50%.
- Turnover = 48,000 ÷ 16,000 = 3.0 turns (below the 4–7 benchmark — over-stocked).
- Annual gross margin $ = 48,000 × 0.50 = $24,000.
- GMROI = 24,000 ÷ 16,000 = 1.5 (well below the 3.0 target — capital is being wasted).
Scenario B — after tightening. The owner cuts average inventory to $8,000 by deleting 18 C-class SKUs and tightening replenishment, while holding COGS at $48,000 (same sales, less dead stock).
- Turnover = 48,000 ÷ 8,000 = 6.0 turns (now inside benchmark).
- GMROI = 24,000 ÷ 8,000 = 3.0 (hits target).
- Cash freed = $8,000, which is redeployed into A-class food and one new kit test.
Same top-line sales, but the category now returns twice the gross margin per inventory dollar and frees $8,000 of working capital. That is the entire game: sell no more, stock smarter.
| Metric | Before | After | Lever |
|---|---|---|---|
| Avg inventory cost | $16,000 | $8,000 | Cut C-class SKUs, tighten WOC |
| Turnover | 3.0 | 6.0 | Lower denominator |
| GMROI | 1.5 | 3.0 | Halved inventory, same margin $ |
| Cash freed | — | $8,000 | Redeployed to A-items + kit test |
Why Scenario Kits De-Risk a New Category
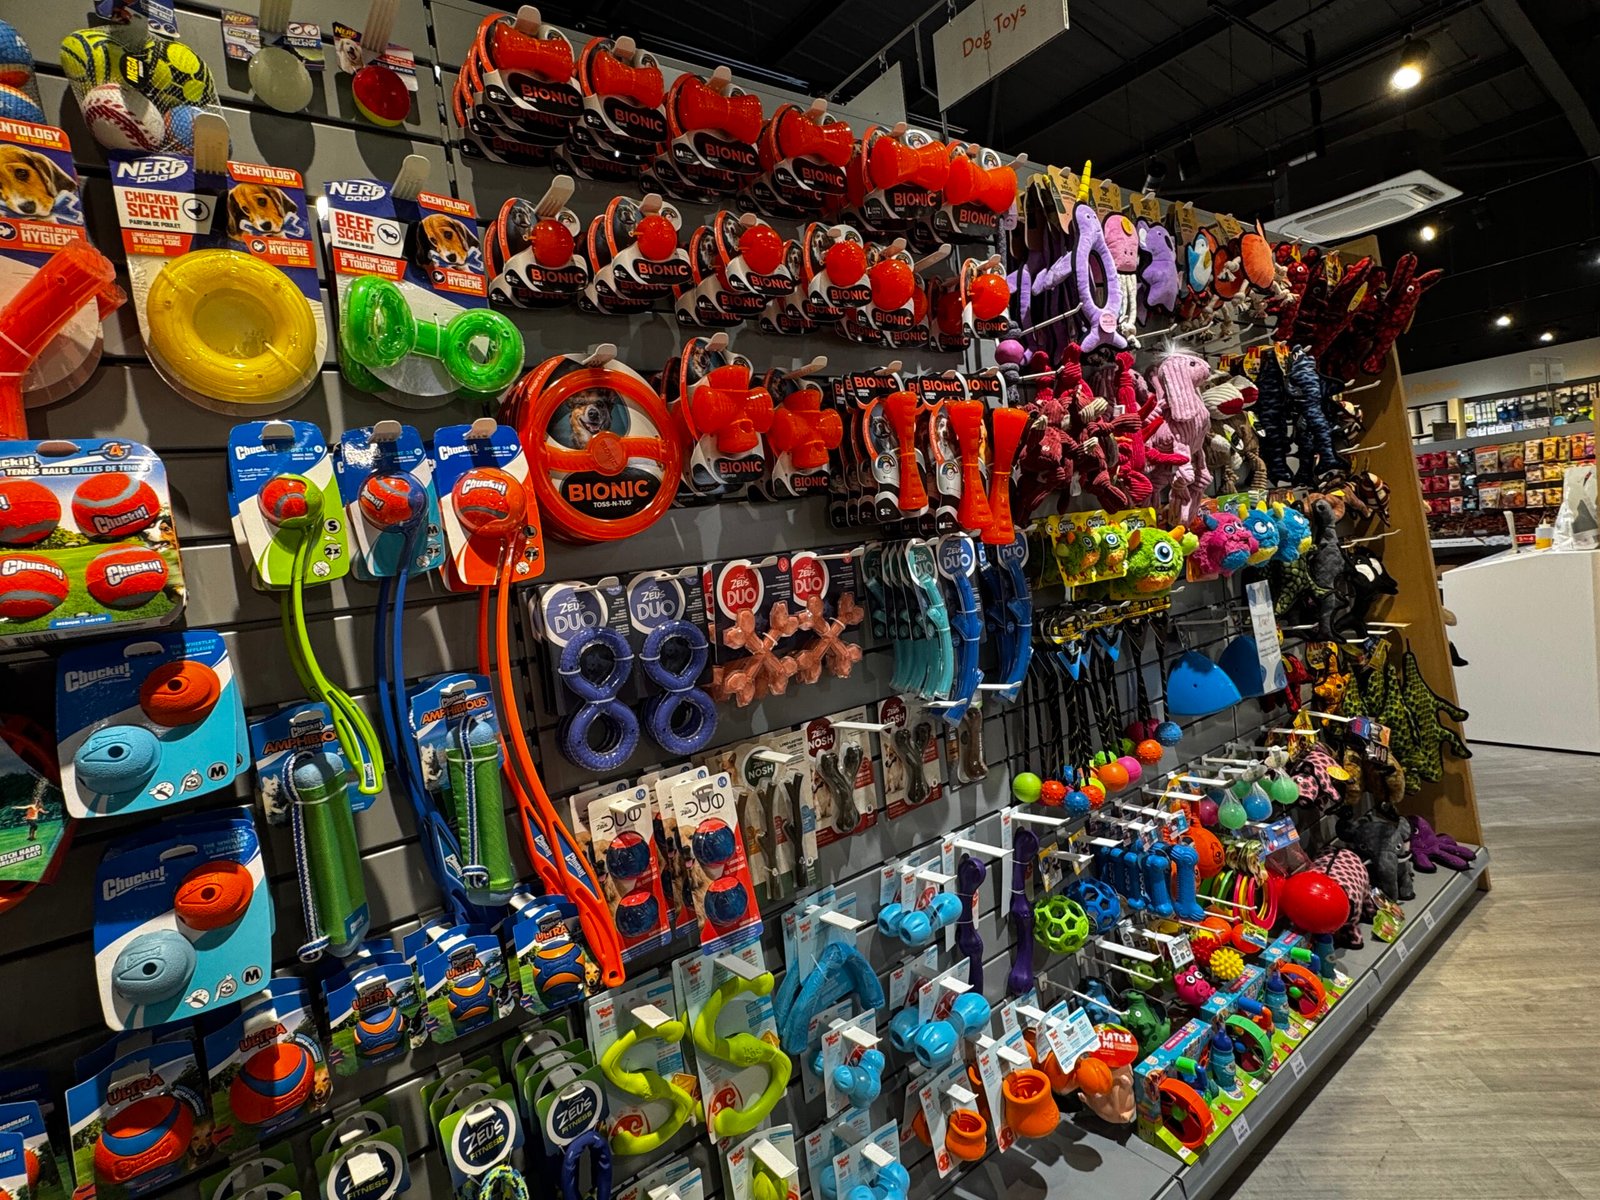
Launching a new category the traditional way is expensive and slow: you research 20–40 individual SKUs, negotiate MOQs with several factories, design shelf space, train staff, and hope it sells. Most of that risk is avoidable.
A scenario-based curated kit flips the model. Instead of buying a category piecemeal, you buy a pre-assembled, themed bundle built by a sourcing expert — e.g., a “new pet owner” kit, a “dental care” kit, or a “holiday gift” kit. The benefits for an independent:
- Lower risk. One PO, one supplier relationship, one compliance file. You are not betting on 30 unproven SKUs; you are betting on one curated theme.
- Fast shelf setup. The kit arrives as a coherent display unit. Staff can explain it in one sentence (“this is our complete new-puppy starter set”). Sell-through is faster because the story is clear.
- Test cheaply. Allocate one seasonal-facing or one end-cap to a kit. If it turns at 6x, promote it into the core. If not, you have learned the category for a fraction of the cost of a full launch.
- Better margins. Curated bundles let you capture the “solution” margin rather than competing on the single-kibble-bag price. See the math in our breakdown of the economics of curated pet store kits.
This is exactly why we build kits around real retail scenarios rather than “a box of random toys.” A Pet Care Hygiene Kit answers a recognizable customer need (“my cat smells / my dog’s breath is bad / I need grooming basics”), which is far easier to merchandise than an abstract category.
Planogram-by-Scenario: A Worked Example
Here is how a 12-foot end-cap could be organized by scenario rather than by vendor — a layout we have seen lift category sell-through by making the customer’s job (“solve my problem”) match the shelf’s logic.
| Zone (4 ft each) | Scenario | Kit / Products | Role |
|---|---|---|---|
| Zone A — New & Young | “Just got a pet” | Pet Store Starter Essentials Kit, Training & Enrichment Kit | Acquire new customers; high attach at first visit |
| Zone B — Health & Care | “Keep them healthy” | Dental & Joint Wellness Kit, Pet Care Hygiene Kit, Slow Feeding Wellness Kit | Highest-margin zone; repeat routines |
| Zone C — Play & Gift | “Treat & celebrate” | Cat Play Kit, Dog Toy Collection Kit, Holiday Celebration Kit | Impulse + gifting; seasonal flexibility |
The planogram’s power is psychological: a customer who walks up for “something for my new kitten” sees the entire solution in one zone, not a scattered hunt across five aisles. End-caps organized by scenario consistently out-perform vendor-block end-caps because they match how people actually shop.
Applying the Math to Kits
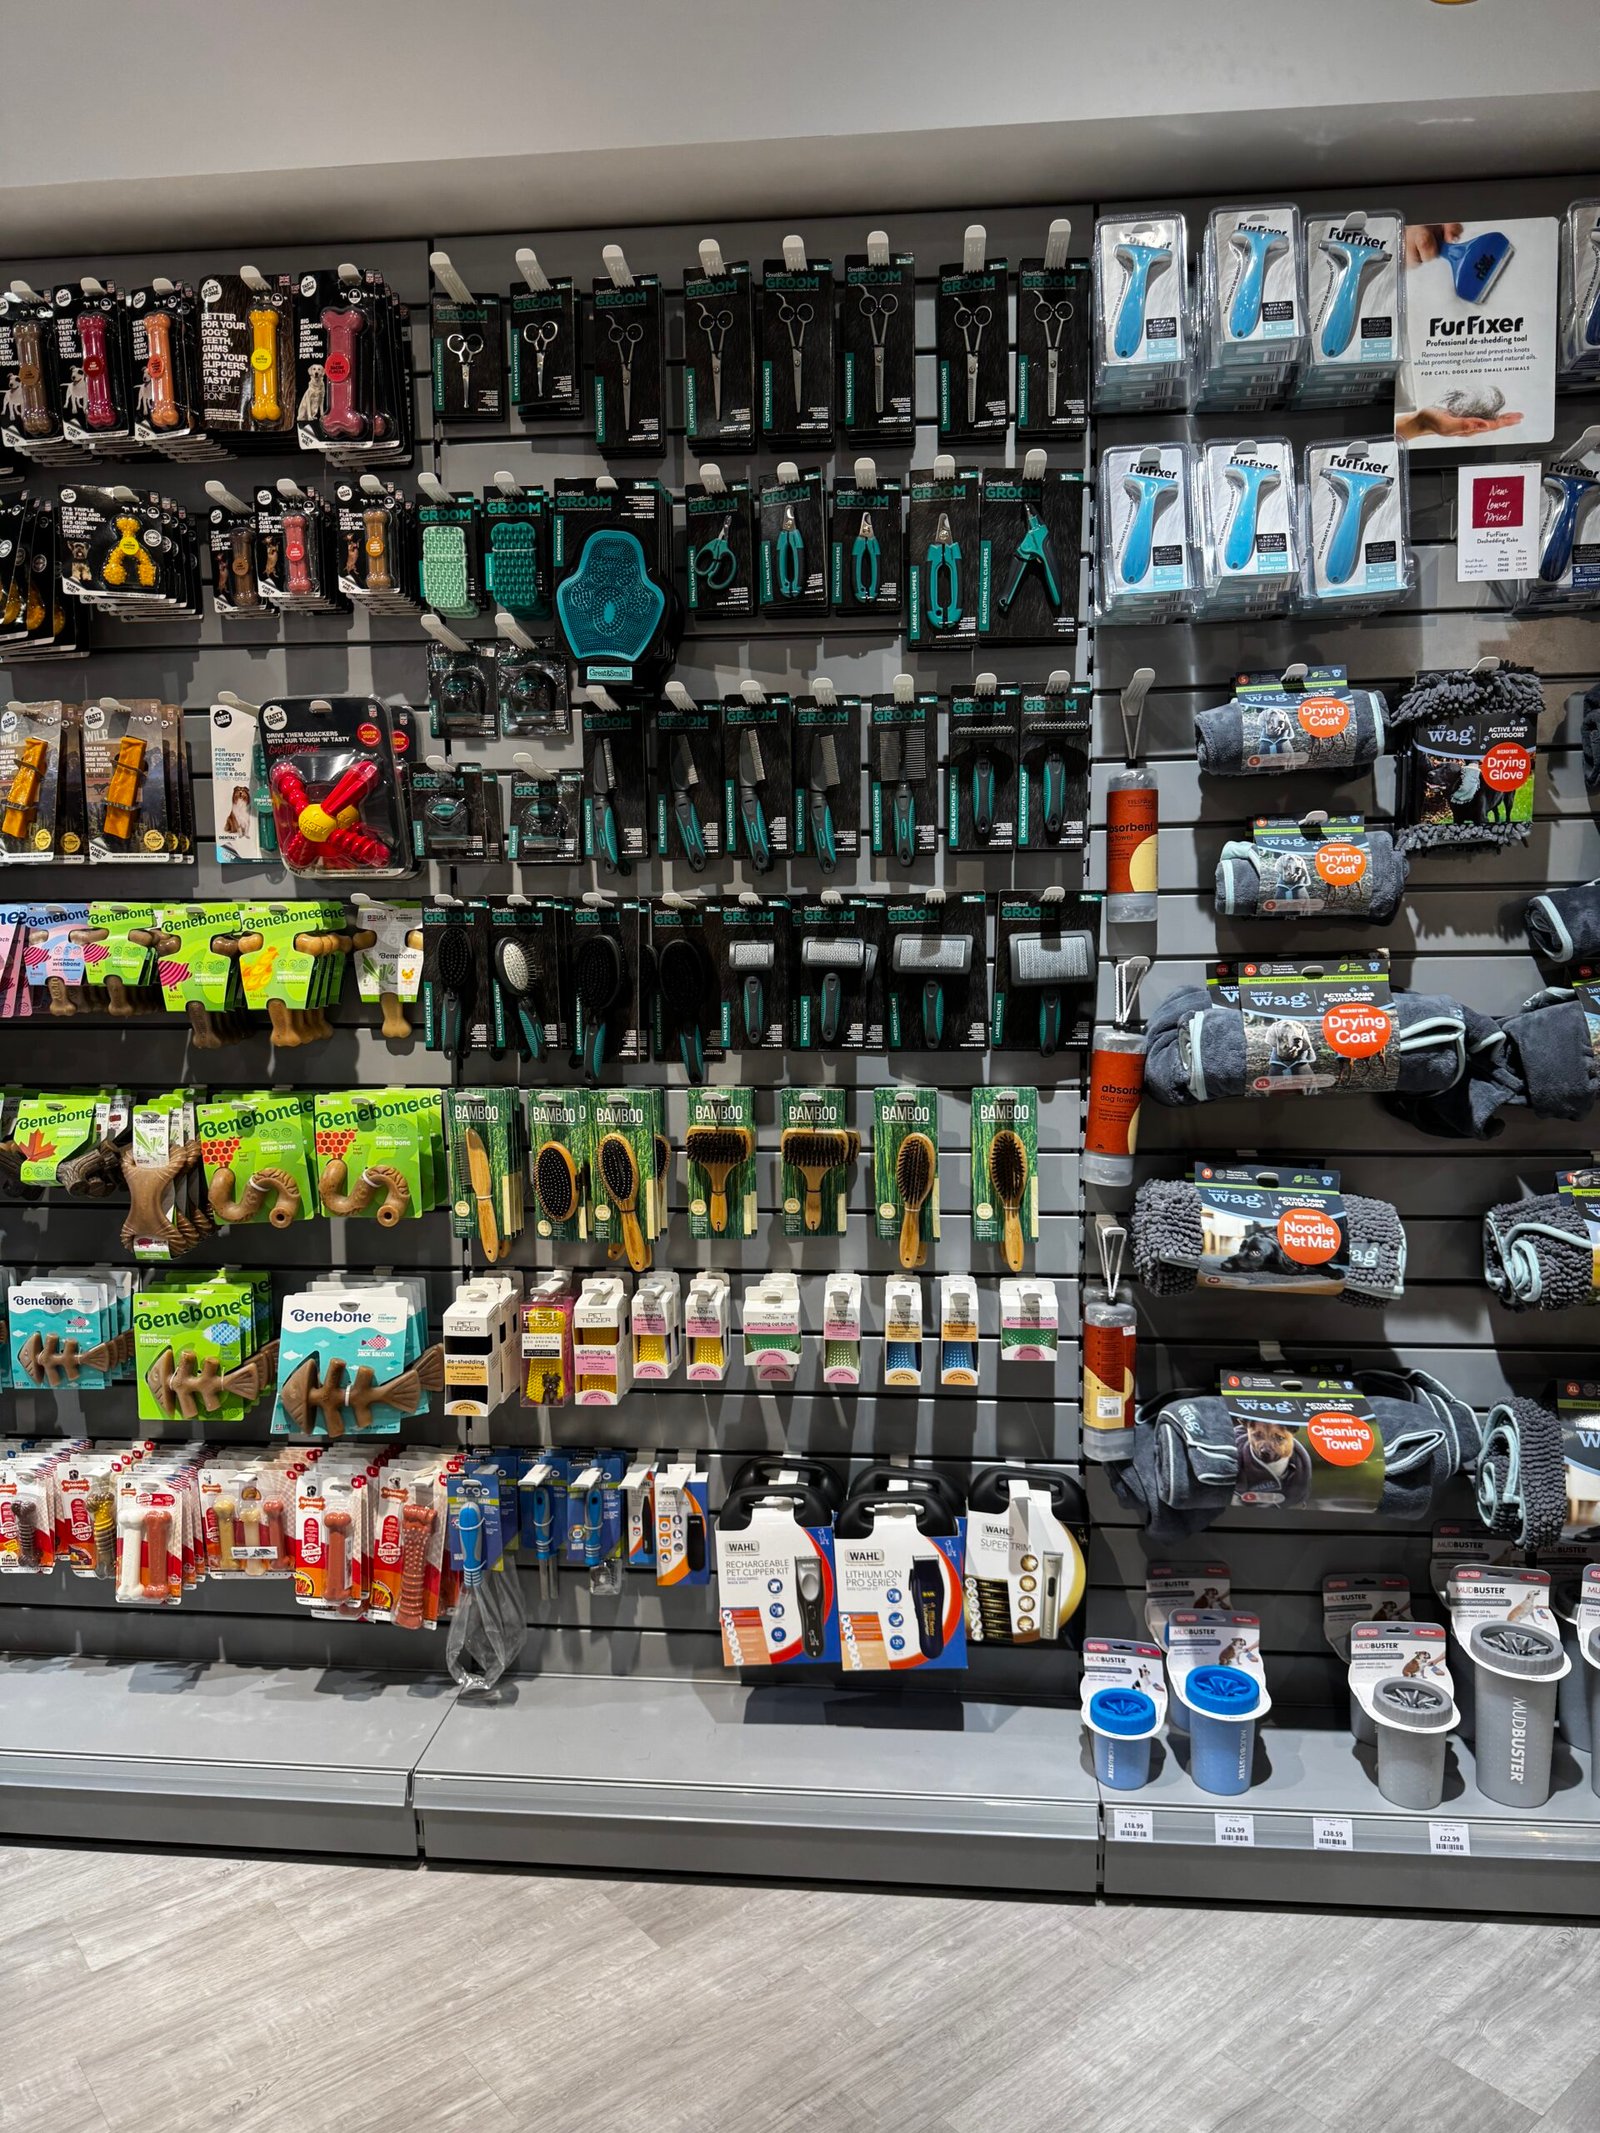
When you evaluate a kit as a buyer, run the same four metrics on the kit as you would on a SKU:
- GMROI of the kit: because kits bundle margin tiers (a lower-margin bowl + a high-margin supplement), the blended GMROI usually lands 3.5–5.0 — above a single-category buy.
- Turnover: kits positioned as solutions turn faster than their slowest component, because the “complete story” drives conversion.
- ABC: treat the kit as an A-class item during its scenario window (e.g., Holiday Celebration Kit in Q4), then rotate.
- WOC: for seasonal kits, set a hard WOC floor of ~0 at season end and markdown proactively rather than carrying dead stock into January.
The Holiday Celebration Kit is the clearest example: its entire value depends on hitting the shelf 6–8 weeks before the holiday and clearing by December 31. The WOC discipline is what separates a profitable holiday from a January write-off.
Mini Case: A First Kit Test in a Neighborhood Store
To make the model tangible, consider a 900 sq ft store that had never stocked a grooming line. Instead of building a 25-SKU grooming wall, the owner allocated one 4-foot end-cap to the Pet Care Hygiene Kit plus the Professional Grooming Kit as a “spa at home” scenario. First month: the kits turned 5.5 times at a blended 52% margin — a GMROI of roughly 3.4, above the store average of 2.8. The owner then promoted the top two kit components into permanent A-item status and dropped the slowest 12 existing C-class SKUs to make room. Net effect: same shelf footprint, higher margin, and a new category proven without a full-scale launch risk.
Sourcing Kits Without Killing Your MOQ Budget
A common objection: “Kits sound great, but don’t they require huge MOQs?” Done wrong, yes. Done through a curated platform, no — because the platform aggregates demand across many small retailers, so the effective per-store MOQ drops dramatically. The negotiation mechanics are worth understanding, which is why we published a full playbook on MOQ negotiation with China manufacturers.
Practical MOQ tactics for the independent:
- Buy the kit, not the component. A factory’s 500-unit MOQ per SKU becomes irrelevant when the platform has already aggregated 5,000 units of the bundle across its retailer base.
- Negotiate by assortment, not by line. Offer the supplier a multi-kit annual commitment in exchange for a lower per-kit minimum.
- Use mixed-SKU cartons. Request assorted cartons so you receive a balanced kit mix without committing to a full carton of any single slow item.
For stores with a distinct local identity (breed-focused, eco-focused, luxury), the Custom Retail Kit lets you specify the scenario and let the platform assemble compliant, on-brand bundles at attainable volumes.
Quarterly Assortment Review Routine
Compliance and math are not one-time events. Run this 60-minute review every quarter:
- Pull GMROI and turnover by category from your POS.
- Re-rank SKUs into A/B/C; flag any A-item with WOC < target (replenish now).
- Flag any C-item with WOC > 2× target (markdown or delete).
- Review seasonal kit performance; promote winners, retire losers.
- Allocate the freed cash: 70% to A-items, 30% to one new kit test.
Stores that do this four times a year compound. Stores that “set it and forget it” slowly drown in C-class dead stock and wonder why cash is tight.
Common Assortment Mistakes Independents Make
Having coached dozens of small retailers, the same errors recur. Avoid these and you are ahead of most of your competition:
- Assorting by vendor, not by customer. Buyers accept whatever the distributor’s catalog pushes, producing a shelf organized by brand. Shoppers do not think in brands; they think in needs. Re-sort by scenario and conversion climbs.
- Chasing margin without turnover. A 70% margin item that turns once a year is worse than a 30% item that turns 15 times. Always read margin and turnover together via GMROI.
- Fear of deleting. Owners keep slow SKUs “just in case.” Those SKUs are silently taxing your rent and cash. Delete with discipline; the freed space earns more from A-items.
- No WOC alerts. Without automatic replenishment triggers, A-items stock out (lost sales) while C-items pile up (trapped cash). The fix is a 30-minute spreadsheet rule, not a software investment.
- Testing new categories too expensively. Launching a full 30-SKU category blind is the expensive way to learn. Use one scenario kit on a single facing first; let demand vote before you commit.
- Ignoring the impulse zone. The checkout and end-cap are your highest-value real estate. Dedicate them to high-margin treats, toys, and a rotating kit rather than to low-margin bulk items.
Markdown Discipline for Seasonal Kits
Seasonal kits live and die by timing. The mistake is hoping a Holiday Celebration Kit sells in January at full price. Set a markdown ladder up front:
- Week -6 to 0 before the holiday: full price, feature prominently.
- Week +1 after: 20% off to clear the stragglers.
- Week +2: 40% off, then donate or bundle remaining units rather than carry into next season.
A planned markdown protects margin better than a desperate post-season fire sale, and it frees shelf and cash for the next scenario. This discipline is why a well-run Holiday Celebration Kit program funds the store’s Q1 reset instead of haunting its storage room.
Assortment Checklist
Before your next buying cycle, confirm:
- Category mix set to the 40/15/15/15/10/5 skeleton (adjusted for local demand)?
- GMROI computed per category; any category <2.0 flagged?
- Turnover targets set per category against benchmarks?
- ABC analysis run; A-items on auto-replenish?
- WOC alerts active per category?
- One seasonal/scenario kit allocated as a low-risk test?
- Planogram organized by scenario on at least one end-cap?
- MOQ strategy using kits to lower effective minimums?
Master these eight, and your assortment becomes a profit engine rather than a guessing game. The independents that win are not the ones with the biggest stores — they are the ones with the sharpest mix.
Ready to stock these ideas? Browse wholesale pet KITs →
Shop these pet categories
Wholesale pricing, no minimum order.
Related wholesale collections
Products mentioned here
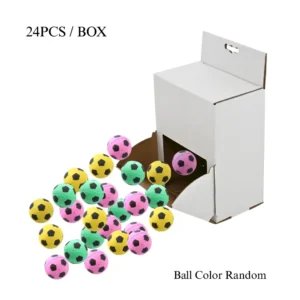 24-Pack Cat Toy Balls – Soft Latex Foam Soccer Ball Toys for Cats, Interactive Chase & Self-Play, Wholesale Pet SuppliesMSRP $8.89Login for wholesale pricing
 4-Pack Acrylic Parrot Toys with Mirror & Beak Grinding Accessories – Colorful Bird Cage Toys for Parrots and CockatielsMSRP $5.89Login for wholesale pricing
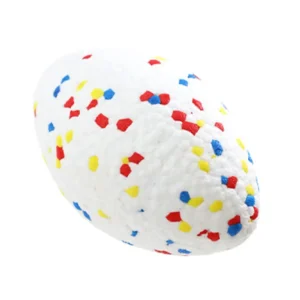 5 Inch Durable Rugby Floating Dog Ball – Chew & Fetch Water Toy for DogsMSRP $4.29Login for wholesale pricing
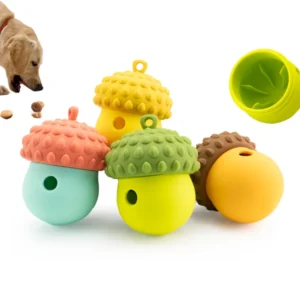 Berry-Shaped Silicone Dog Treat Dispensing Slow Feeder Toy – Durable Chew & Interactive Training Ball(MOQ 24)MSRP $3.56Login for wholesale pricing